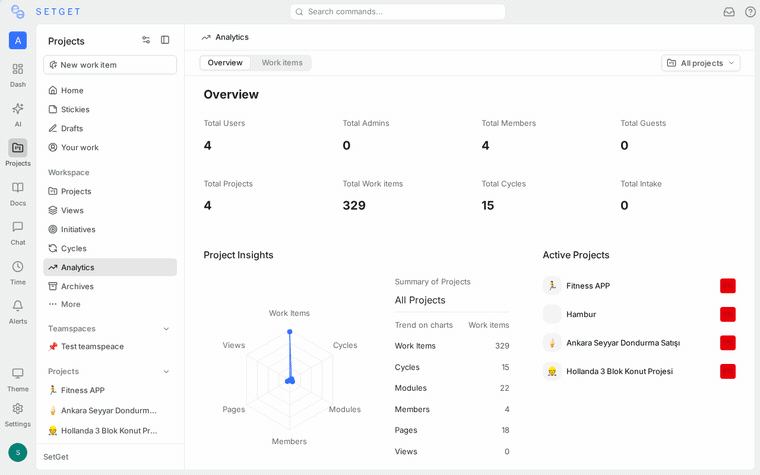
Analytics
SetGet analytics gives you insight into how work flows through your workspace and projects. Understand where work items are stuck, who has the most on their plate, which priorities dominate, and how trends shift over time. Analytics helps teams make informed decisions about planning, resource allocation, and process improvement.
Analytics levels
SetGet provides analytics at two levels:
| Level | Scope | Where to find it |
|---|---|---|
| Workspace analytics | All projects in the workspace | Sidebar > Analytics |
| Project analytics | A single project | Project > Analytics tab |
Workspace analytics aggregates data across all projects you have access to. Project analytics focuses on a single project's data.
Data dimensions
Analytics can be sliced by the following dimensions:
| Dimension | Description | Example insight |
|---|---|---|
| State | Distribution across workflow states | "60% of work items are in Backlog -- our triage process needs attention" |
| Priority | Distribution by priority level | "25 Urgent items have been open for more than 2 weeks" |
| Assignee | Work items per team member | "Alice has 3x more In Progress items than anyone else" |
| Label | Distribution by label | "Bug-labeled items make up 40% of the backlog" |
| Cycle | Progress within a cycle | "We completed 70% of the cycle's scope with 3 days remaining" |
| Module | Progress within a module | "The Authentication module is 90% complete" |
| Created date | When work items were created | "Issue creation spiked after the release on March 15" |
| Completed date | When work items were finished | "Throughput dropped in the last two weeks" |
Charts and visualizations
Distribution charts
Distribution charts show how work items are currently spread across a dimension.
| Chart | X-axis | Y-axis | Best for |
|---|---|---|---|
| State distribution | States | Work item count | Understanding backlog health |
| Priority distribution | Priority levels | Work item count | Identifying urgency imbalance |
| Assignee workload | Team members | Work item count | Detecting overloaded members |
| Label breakdown | Labels | Work item count | Understanding work categories |
Distribution charts are available as bar charts, pie charts, or tables.
Trend charts
Trend charts show how a metric changes over time.
| Chart | What it tracks | Best for |
|---|---|---|
| Created vs. completed | New items created and items completed per day/week | Measuring throughput vs. input |
| Backlog trend | Backlog size over time | Spotting backlog growth |
| Cycle burndown | Items remaining in a cycle | Tracking cycle progress |
| State flow | Items moving between states per day | Identifying bottlenecks |
Burndown chart
The burndown chart is available at the cycle level. It shows:
- Ideal line -- the straight diagonal from total scope to zero.
- Actual line -- how many items remain each day.
- Scope changes -- additions to the cycle after it started.
The gap between the ideal and actual lines reveals whether the team is ahead, on track, or behind.
TIP
If the actual line consistently runs above the ideal line, the cycle scope may be too large. Consider reducing scope or extending the cycle.
Cumulative flow diagram
The cumulative flow diagram shows the count of work items in each state group over time, stacked. It helps identify:
- Bottlenecks -- a widening band for a specific state means items are accumulating there.
- Throughput -- the rate at which items flow through to completion.
- Scope changes -- the total height of the diagram increases when new items are added.
Custom date ranges
All analytics views support custom date ranges:
| Preset | Period |
|---|---|
| Last 7 days | Past week |
| Last 30 days | Past month |
| Last 90 days | Past quarter |
| This cycle | Current active cycle dates |
| Custom | Select start and end dates |
TIP
Use "This cycle" to focus analytics on the current sprint. Use "Last 90 days" for quarterly reviews.
Filtering analytics
Apply filters to narrow the data:
| Filter | Options |
|---|---|
| Project | Select one or more projects (workspace level) |
| State | Select specific states |
| Priority | Select specific priority levels |
| Assignee | Select specific members |
| Label | Select specific labels |
| Cycle | Select a specific cycle |
| Module | Select a specific module |
Filters are additive -- applying multiple filters shows the intersection of all conditions.
Workspace analytics
Workspace analytics provides a cross-project view:
Key metrics
| Metric | Description |
|---|---|
| Total open work items | Count of items not in Completed or Cancelled states |
| Items completed this week | Count of items moved to Completed this week |
| Average completion time | Mean time from creation to completion |
| Overdue items | Items past their due date that are not completed |
| Active cycles | Number of cycles currently in progress |
| Active members | Members who updated at least one item this week |
Project comparison
Compare projects side by side:
| Project | Open | In Progress | Done this week | Overdue |
|---|---|---|---|---|
| Web | 120 | 15 | 8 | 3 |
| API | 85 | 10 | 12 | 0 |
| Mobile | 60 | 8 | 5 | 2 |
Project analytics
Project analytics focuses on a single project and adds project-specific views:
- State distribution with state-group coloring.
- Cycle performance comparing planned vs. actual completion across past cycles.
- Module progress showing percentage complete for each module.
- Member contribution showing items created, updated, and completed per member.
Exporting analytics data
Export any analytics view as CSV or PNG:
- Navigate to the analytics view.
- Click Export.
- Choose CSV (raw data) or PNG (chart image).
- The file is downloaded to your machine.
CSV exports include one row per data point with columns for the dimension, metric, and date range.
WARNING
Analytics exports reflect the current filter and date range settings. Adjust filters before exporting to get the data you need.
Velocity tracking
Velocity measures how many work items (or estimate points) a team completes per cycle. SetGet tracks velocity across cycles automatically:
| Metric | Description |
|---|---|
| Items completed per cycle | Count of work items moved to Completed in each cycle |
| Points completed per cycle | Sum of estimates for completed items |
| Average velocity | Rolling average over the last 3-5 cycles |
| Velocity trend | Whether velocity is increasing, stable, or decreasing |
Use velocity data during sprint planning to determine how much work to pull into the next cycle.
TIP
Velocity stabilizes after 3-5 cycles. Do not use early cycles as reliable predictors. Wait for the rolling average to settle before using it for planning.
Bottleneck detection
SetGet highlights potential bottlenecks in the analytics views:
| Indicator | What it means | Suggested action |
|---|---|---|
| Growing "In Progress" count | Items are starting but not finishing | Check for blockers, reduce WIP |
| High "In Review" duration | Reviews are taking too long | Add reviewers, reduce batch sizes |
| Stale backlog items | Items in Backlog for 30+ days | Triage and prioritize or archive |
| Uneven assignee load | One member has 3x more items | Redistribute work |
Frequently asked questions
Can I build custom analytics queries?
The analytics views provide predefined dimensions and filters. For custom queries, use the JSON export and process the data in your preferred analytics tool.
How often is analytics data updated?
Analytics data is computed in real time. Changes to work items are reflected immediately in analytics views.
Can guests access analytics?
No. Analytics is restricted to members, admins, and owners. Guests can view only their own intake submissions.
Can I embed analytics in external dashboards?
Use the export feature (CSV or JSON) to feed analytics data into external tools. For real-time feeds, use webhooks to push events to your analytics platform.
Permissions
| Role | Workspace analytics | Project analytics |
|---|---|---|
| Owner | Full access | Full access |
| Admin | Full access | Full access |
| Member | Projects they belong to | Projects they belong to |
| Guest | No access | No access |